Hey,
I'm Jack.
Data analyst & engineer — data modeling, ETL pipelines, and analytics.

If you want to chat...
Otherwise, check out my work!
My Story So Far

Bachelor's Degrees
Furman University
May 2025
Graduated with four degrees: B.S. in Computer Science with a minor in Data Analytics, B.S. in Applied Mathematics, B.A. in Business Administration, and B.S. in Information Technology. 3.6/4.0 GPA.
2026

Data Analyst
Shoals Technologies Group
Data liaison on a company-wide CPQ/CRM/ERP modernization, designing a 300+ table enterprise data model (DBML) and a bitemporal PostgreSQL source of truth.
April 2024 – Present
SQL
Python
DBML
PostgreSQL
Data Modeling
Data Quality
Salesforce
Tableau
2025
VIEW PDF
Furman Engaged 2025
Furman University
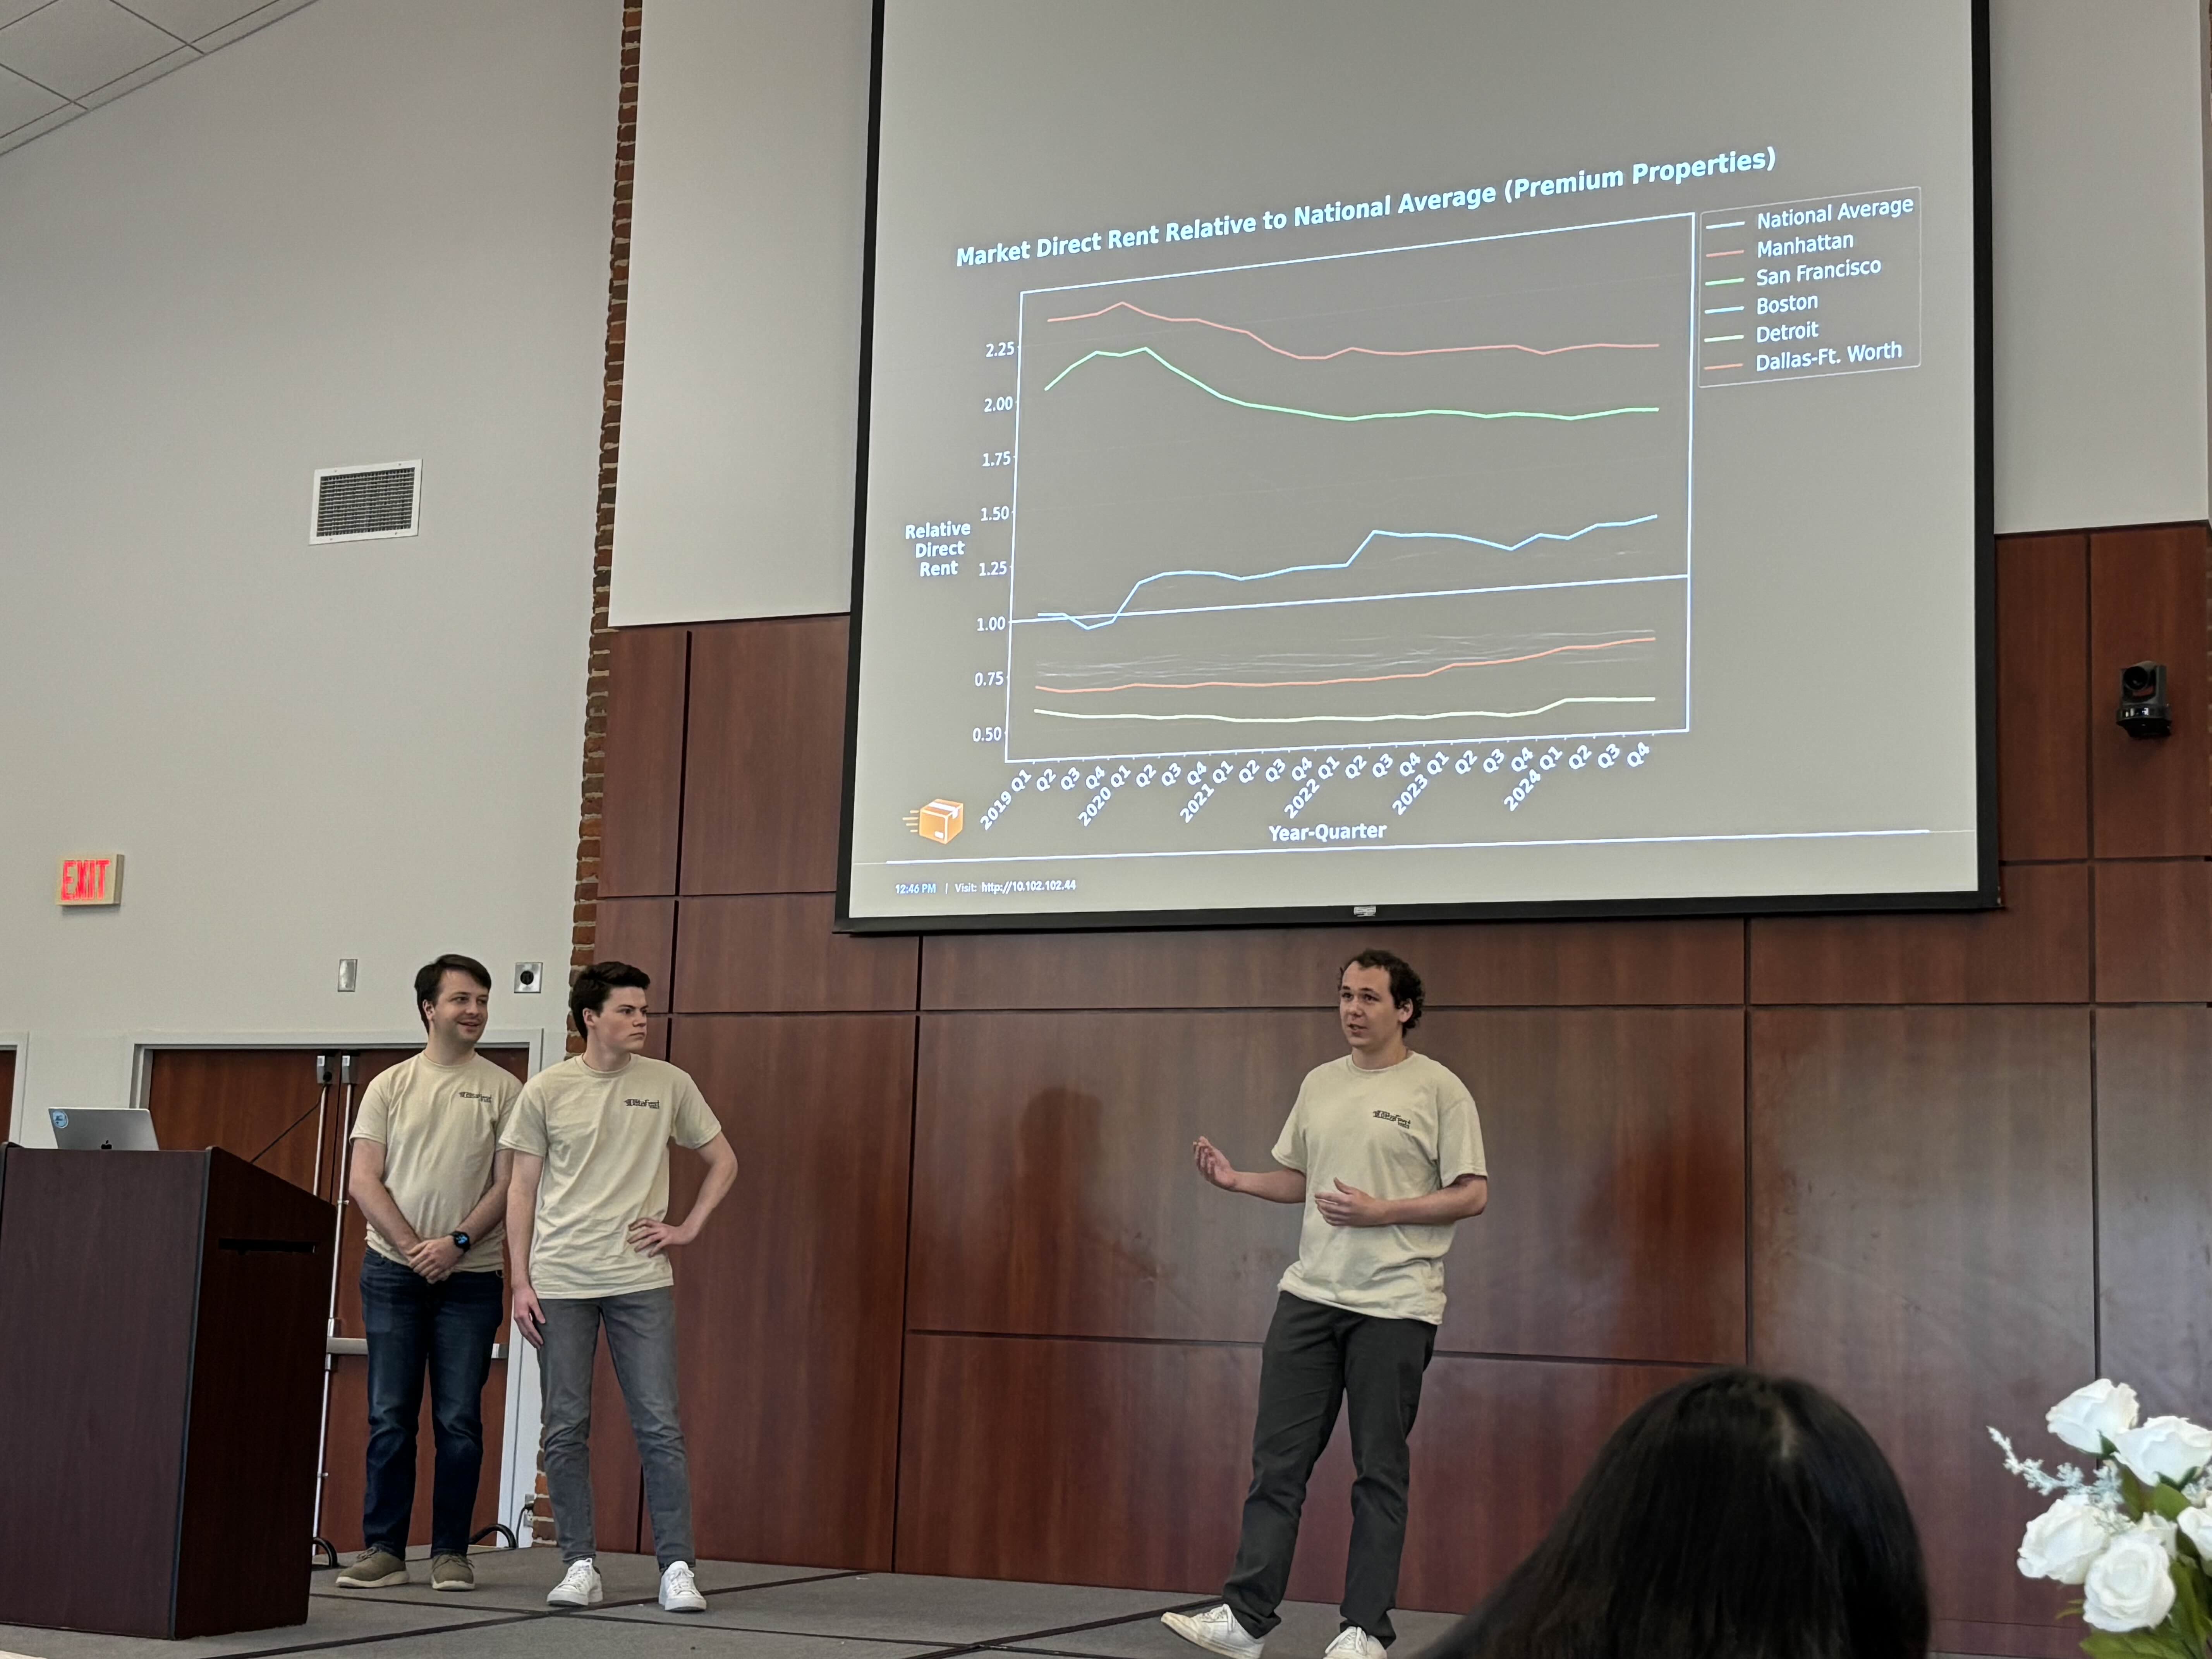
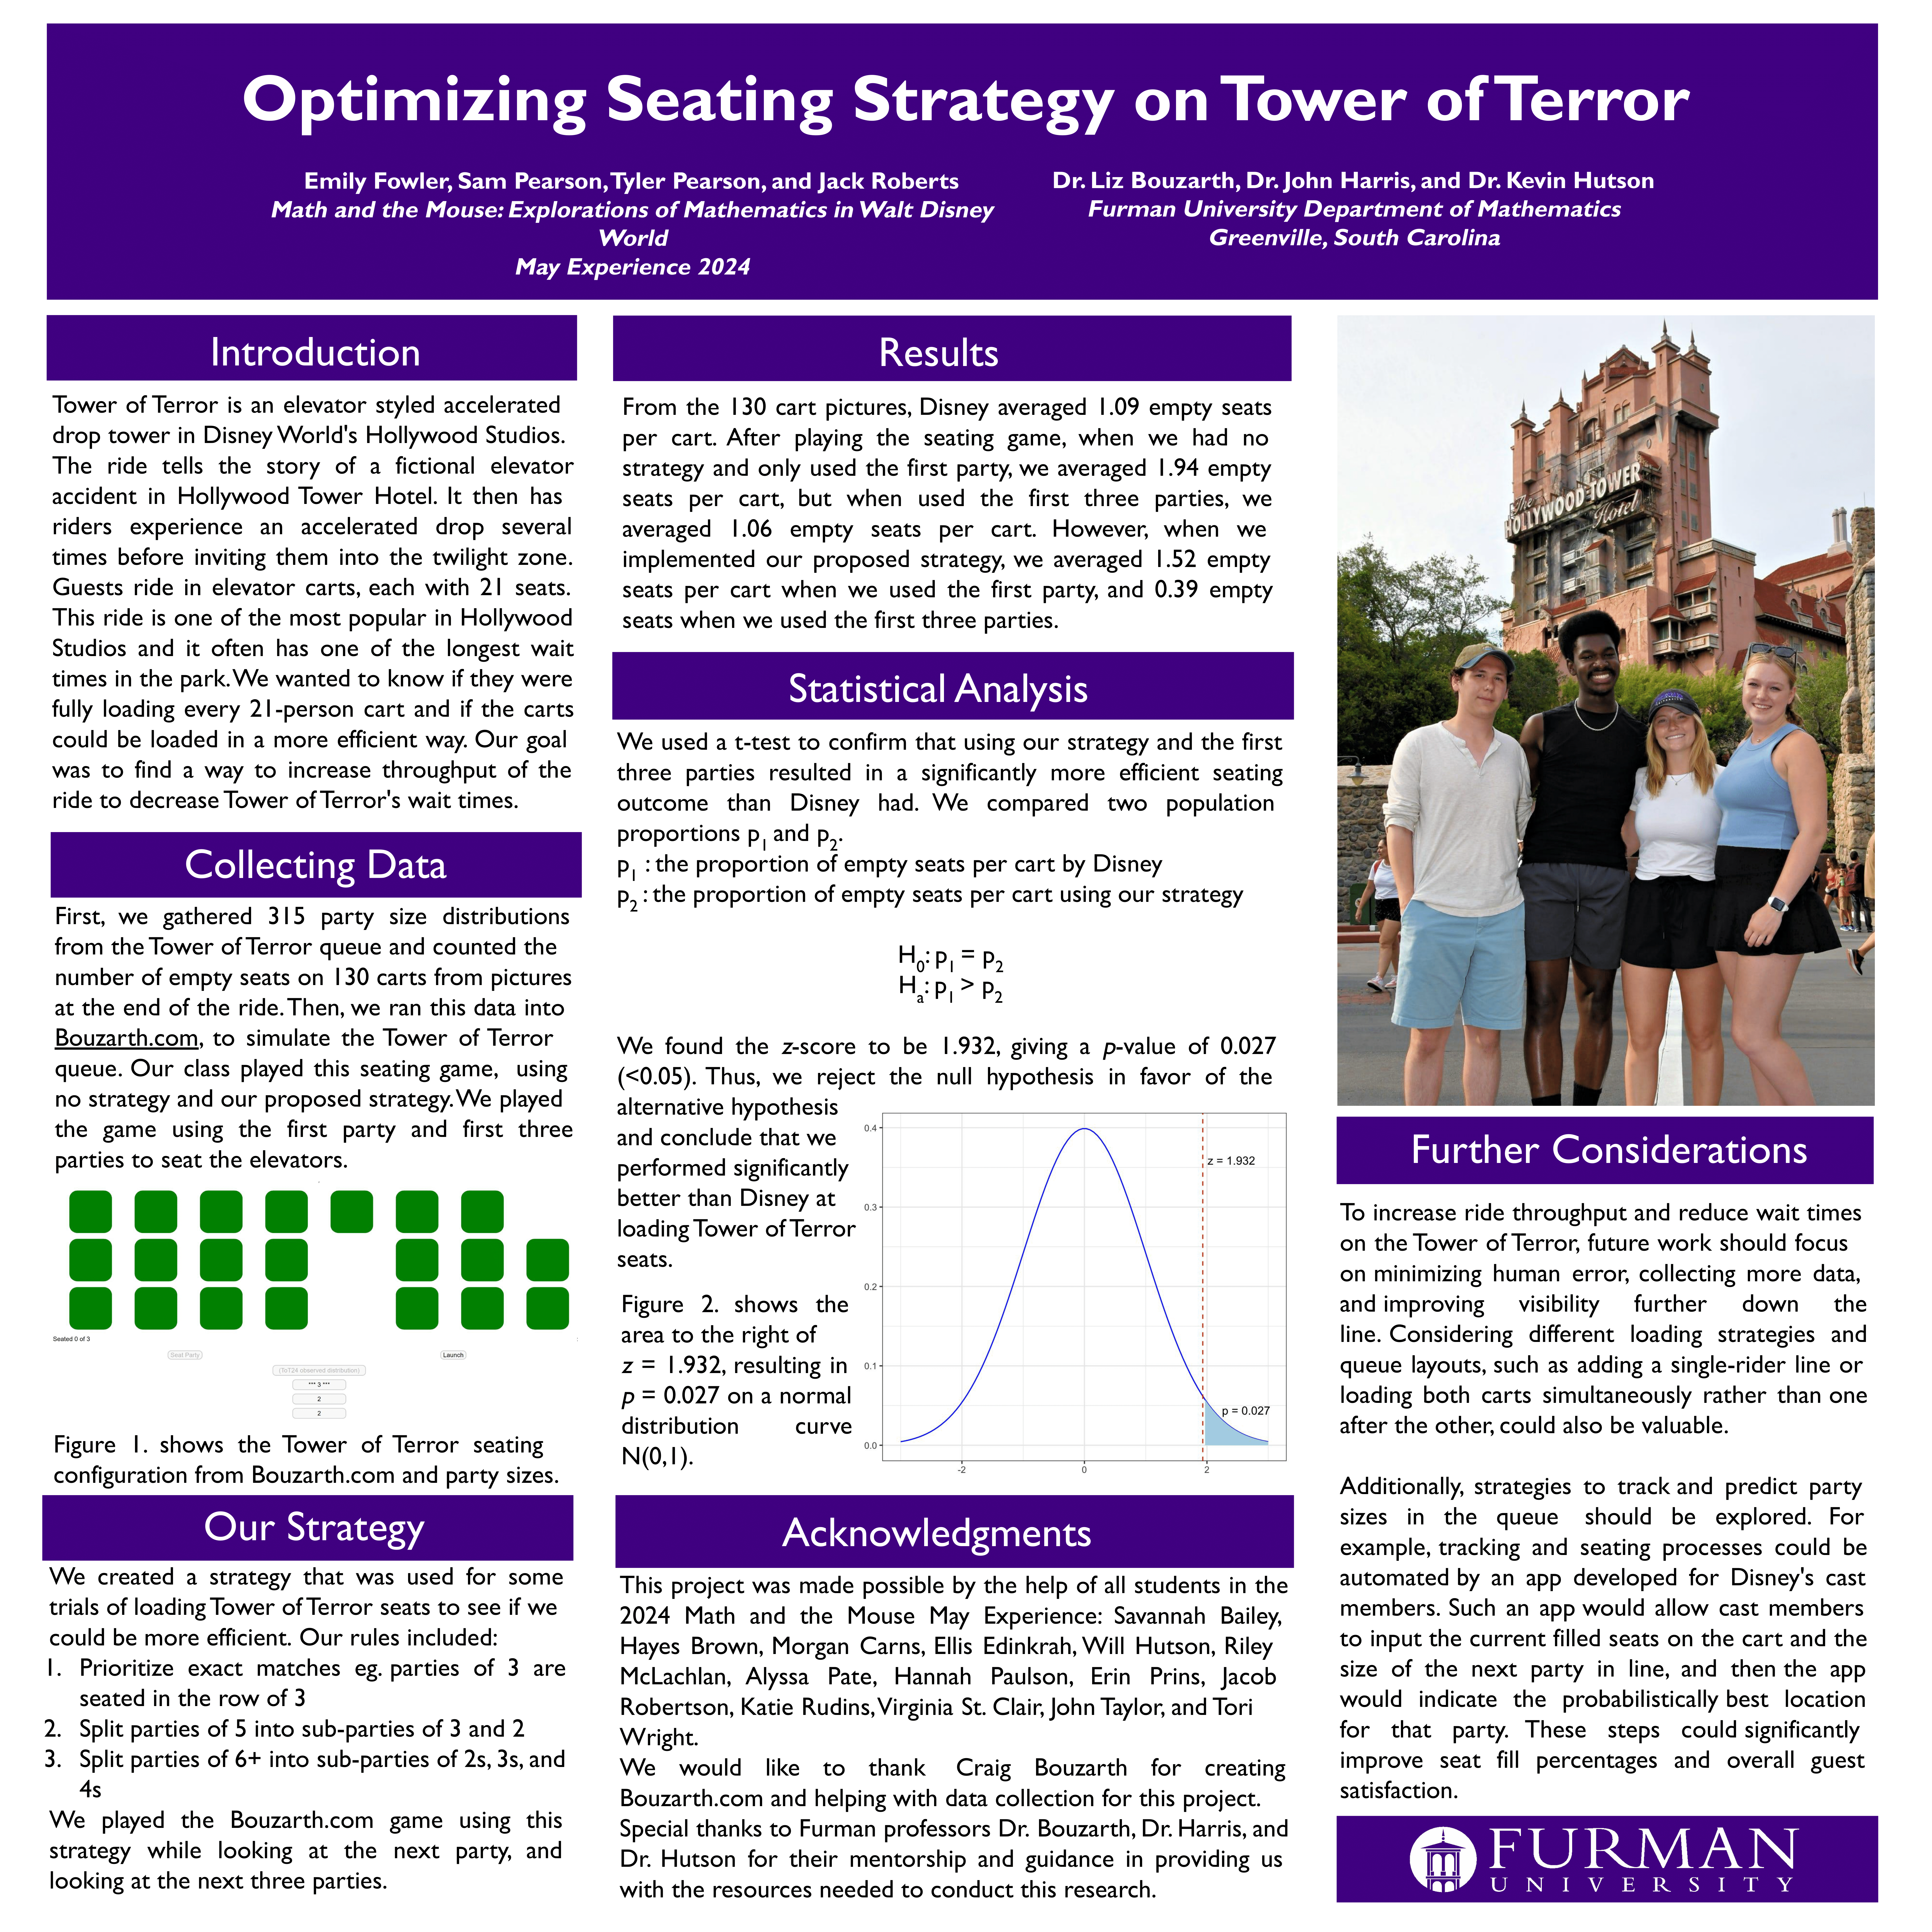
Presentation to the student body on my research with Walt Disney World Resort from May 2024. Improved seating efficiency on the Tower of Terror ride by 5%, translating to an additional $20.8M per year in ticket sales.
April 2025
R
Python
JavaScript
HTML/CSS
GGPlot2
VIEW PDF
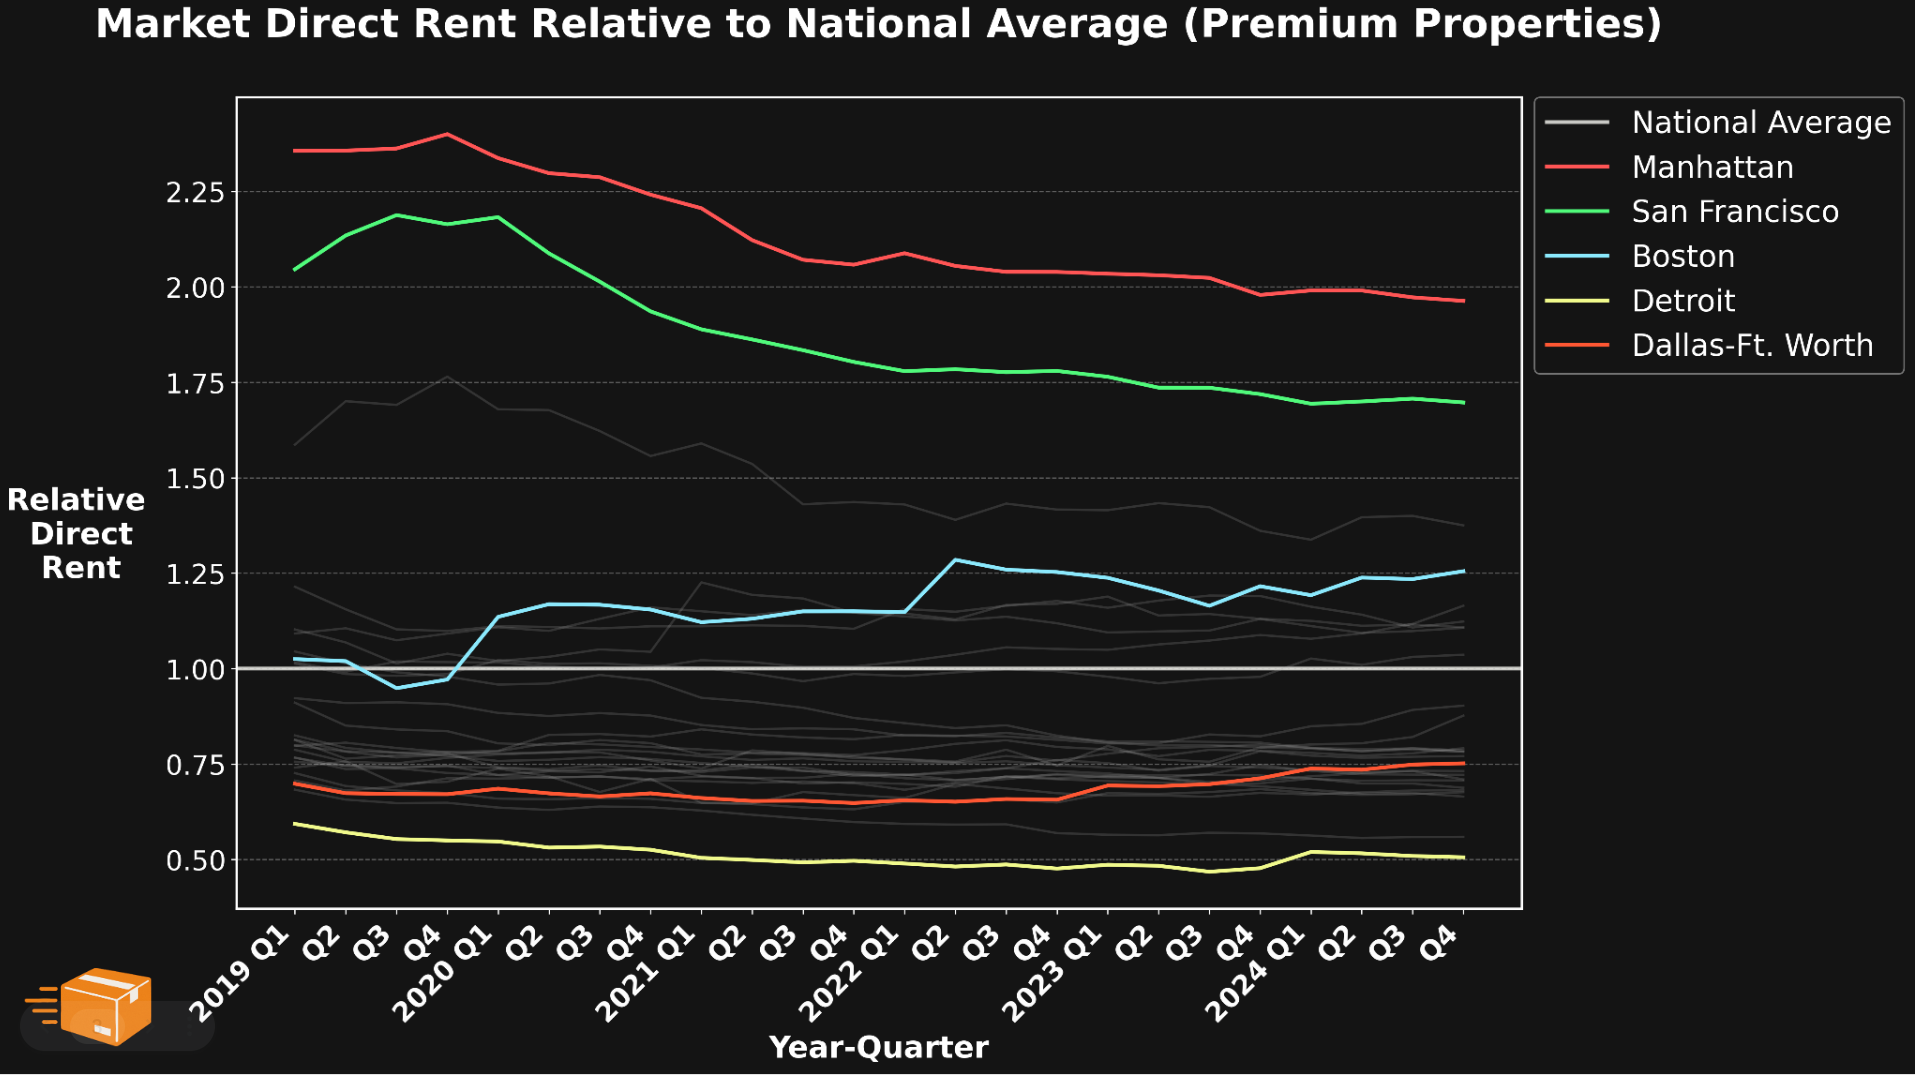
DataFest 2025
Furman University
Weekend-long data analytics competition against students from Furman and Emory. Won "Best Visualization" with two teammates.
April 2025
Python
Matplotlib
Pandas
Excel
2024
GitHub →
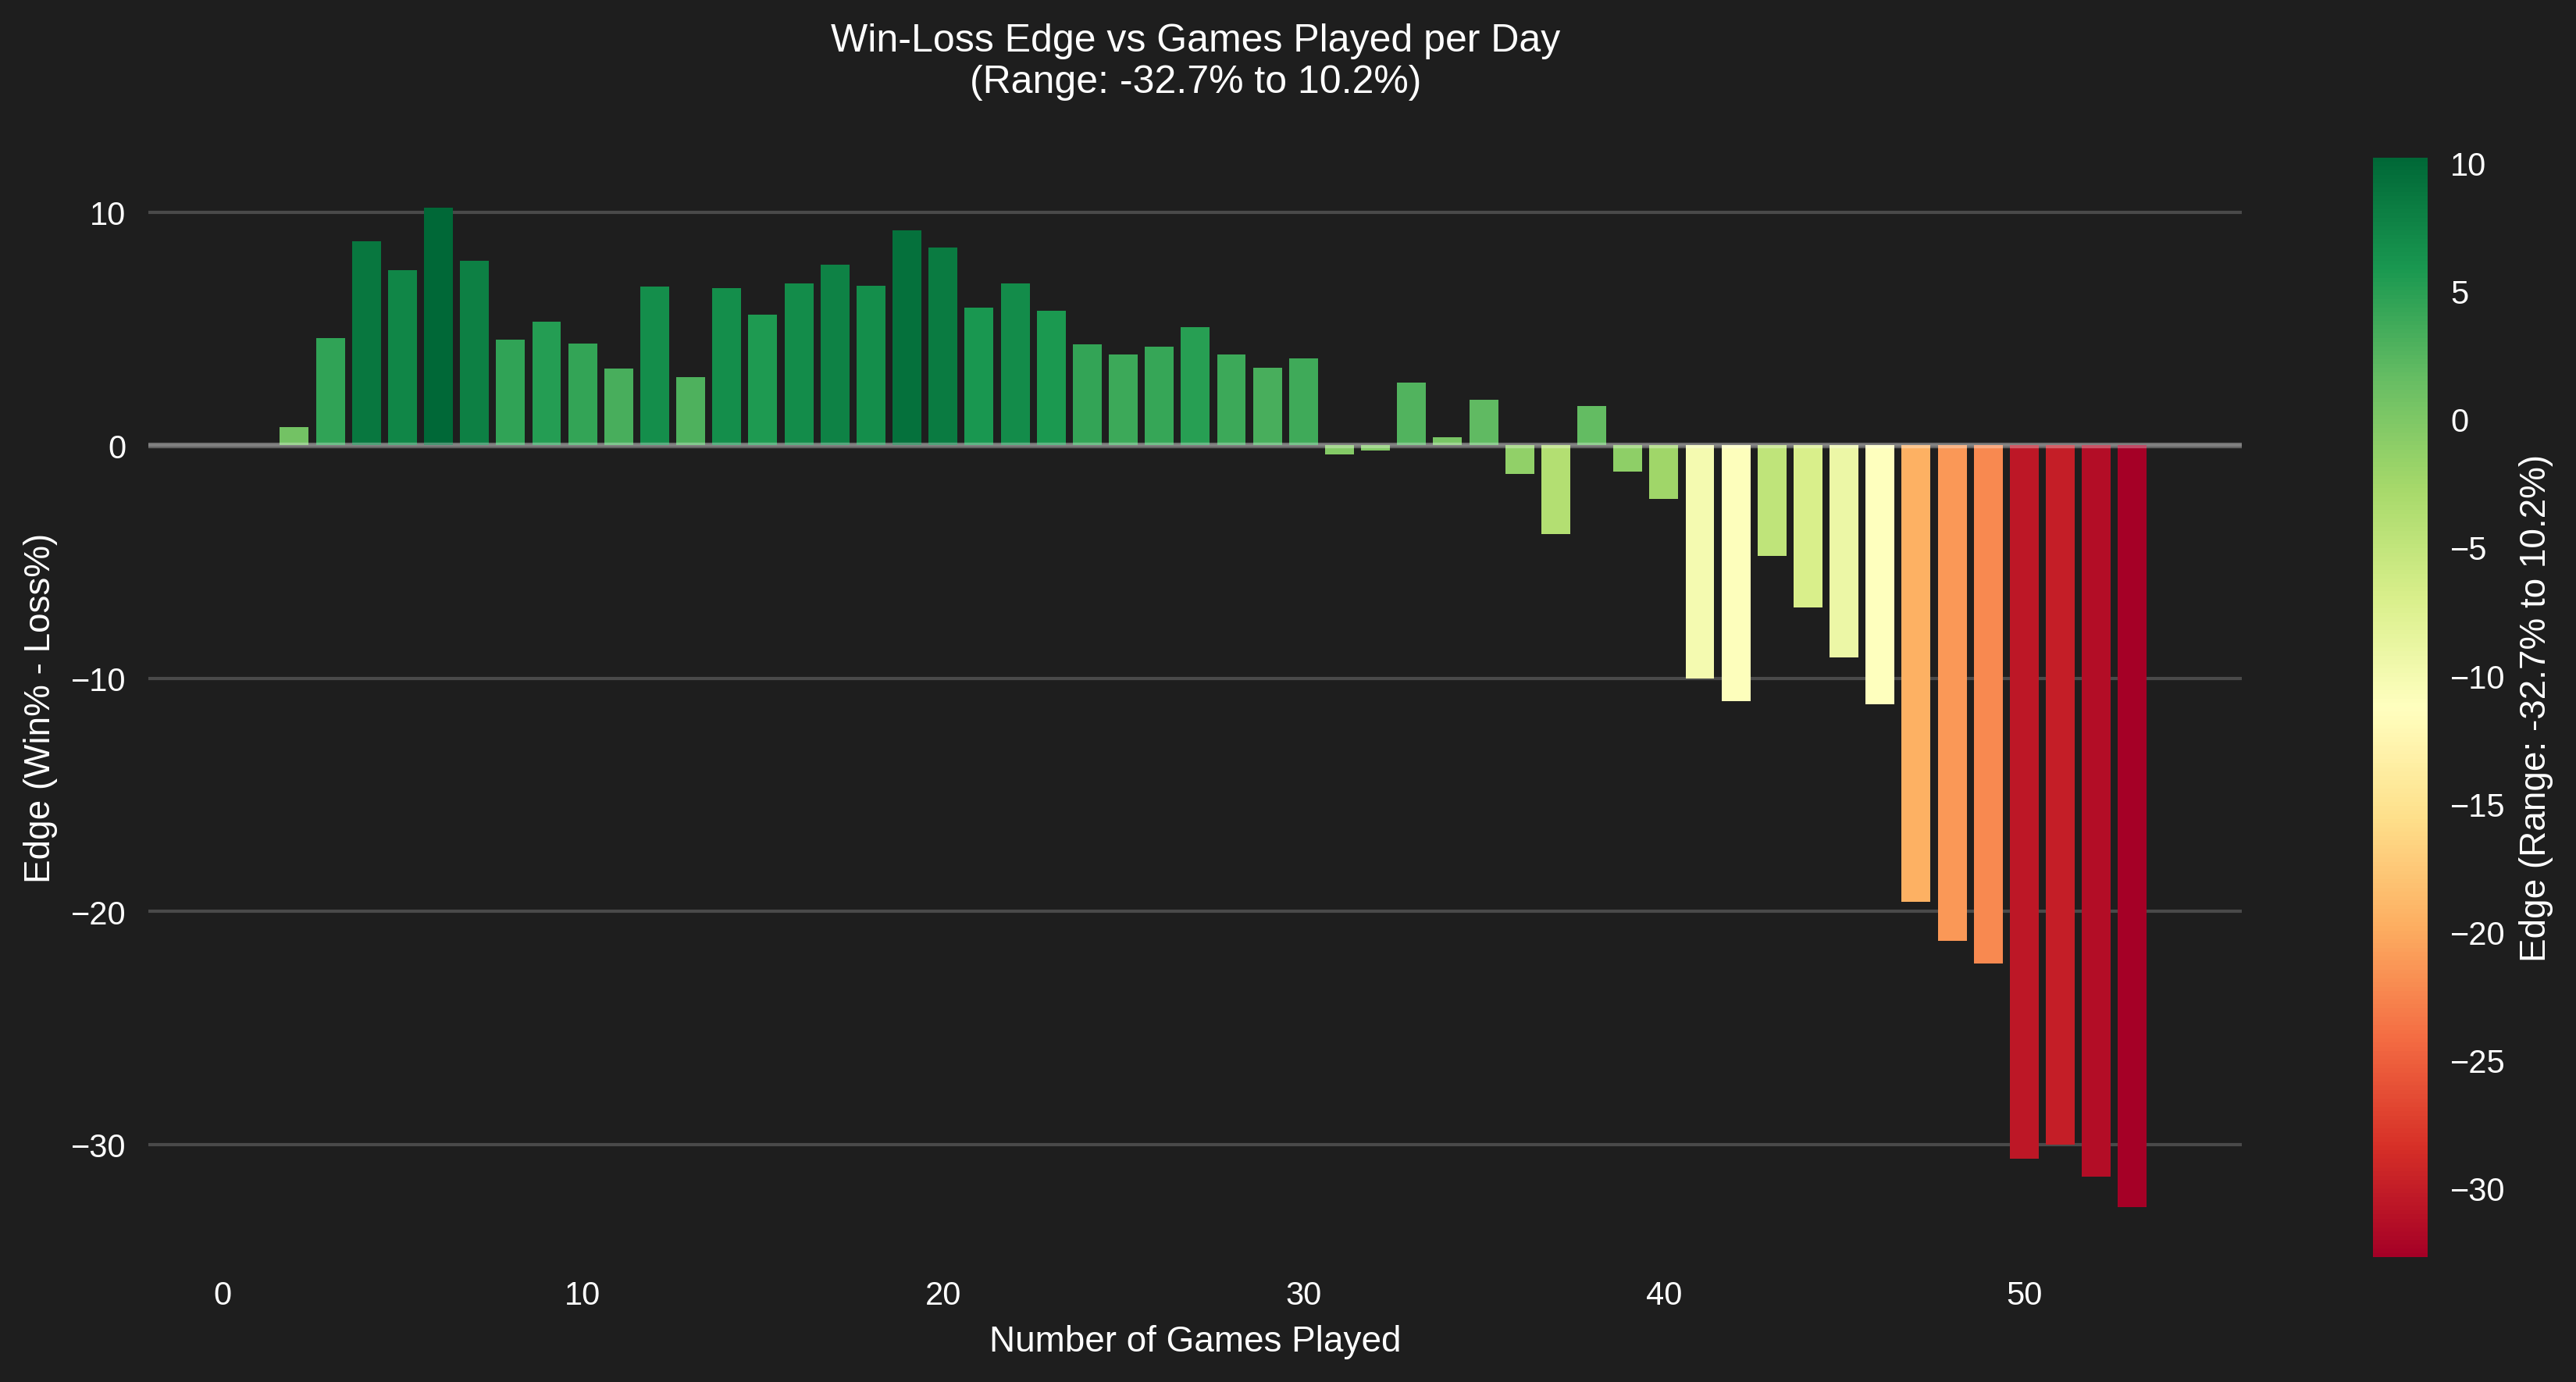
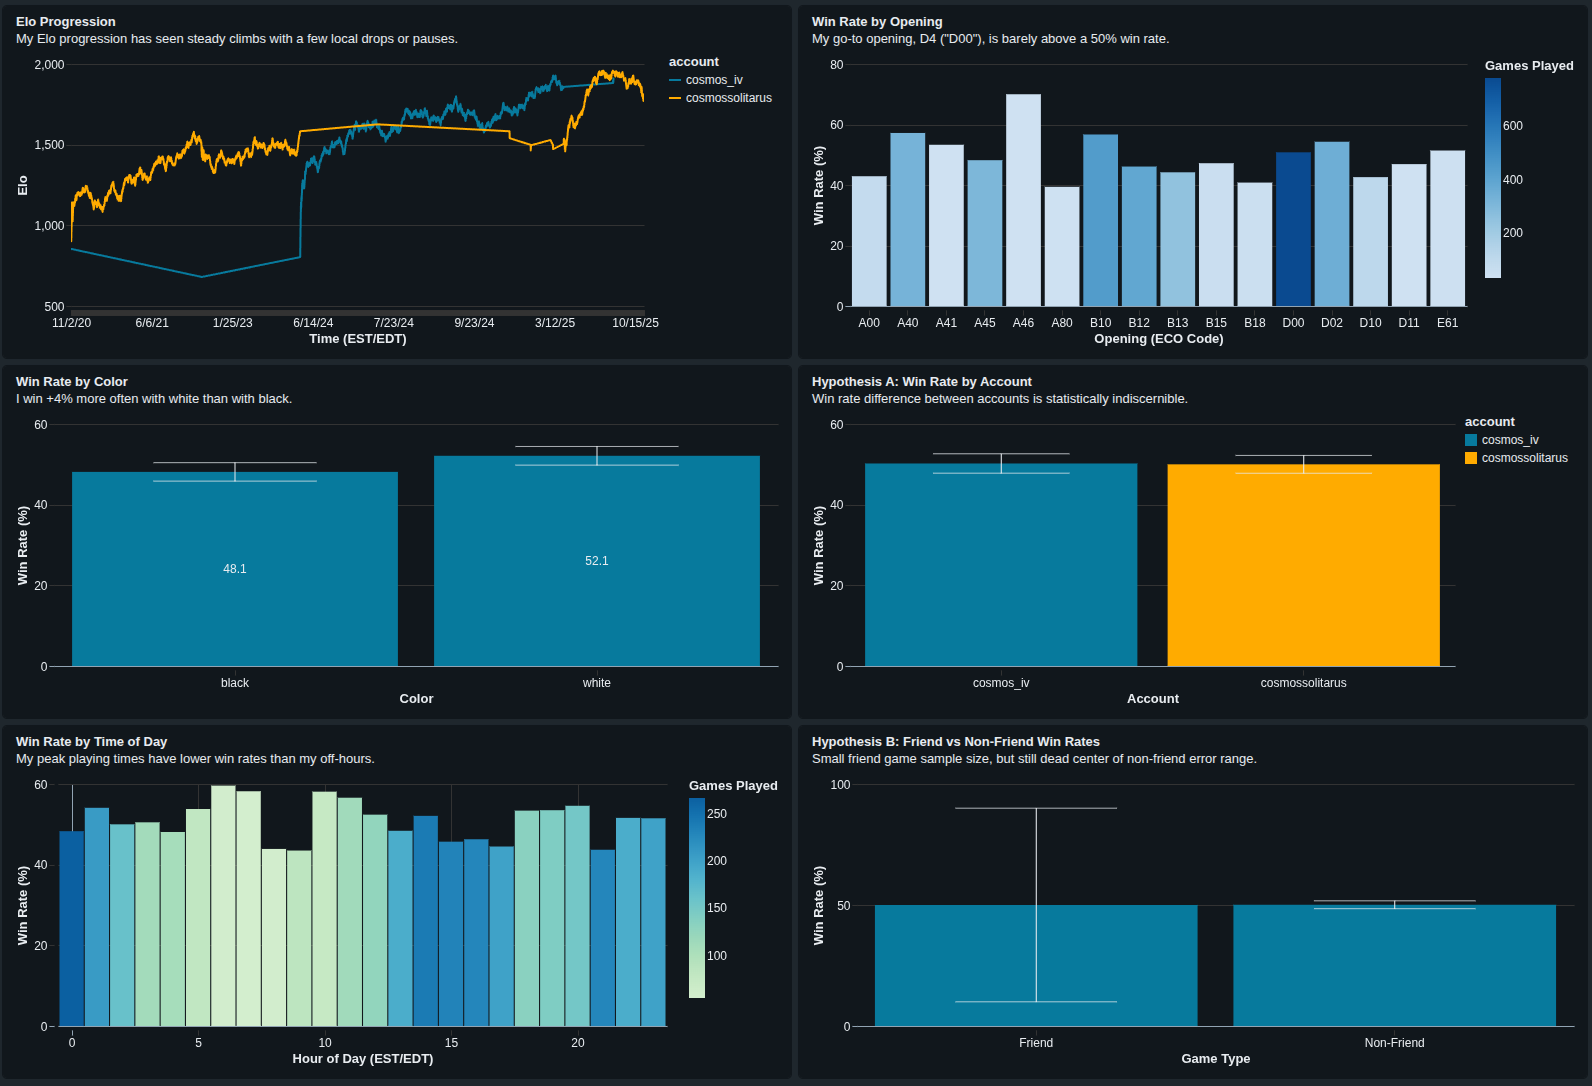
Chess Match Analysis
Independent
Engineered 48 features from 3500 personal chess games using
the Chess.com API to predict the outcomes of my games with
XGBoost. Identified loss-prone patterns and achieved a 15%
increase in my win percentage. Rebuilt in 2026 as an end-to-end
AWS + Databricks pipeline — see Chess Data Pipeline and Analysis.
September 2024
Python
Pandas
Matplotlib
XGBoost
Data Quality and Assembly Line Researcher
BMW Group
Uncovered discrepancies between 2 internal defect reporting datasets using statistical tests. Launched and maintained a production Flask-based internal website to forecast and monitor assembly line bottlenecks in real time, assisting managers in reallocating resources to minimize downtime.
August 2024 - May 2025
Flask
JavaScript
HTML/CSS
Model Deployment

Attraction Efficiency Researcher
The Walt Disney Company
Collected 1100 data points on party sizes and seat utilization on Hollywood Studios' Tower of Terror to model and evaluate 7 seating strategies. Presented a human-implementable strategy that reduced unfilled seats and wait time by 5%, adding 480 riders per day.
May 2024
R
GGPlot2
VIEW PDF
Furman Engaged 2024
Furman University
Presentation to the student body on my research on factors affecting diastolic blood pressure of pregnant women. Challenged traditional indicators of maternal health such as age and blood sugar, while identifying body temperature as an underappreciated factor.
April 2024
R
Tidyverse
GGPlot2
Data Visualization
DataFest 2024
Wake Forest University
Weekend-long data analytics competition against students from Furman and Wake Forest. Finalist with three teammates.
April 2024
Python
Pandas
Matplotlib
Excel
2023
VIEW PDF
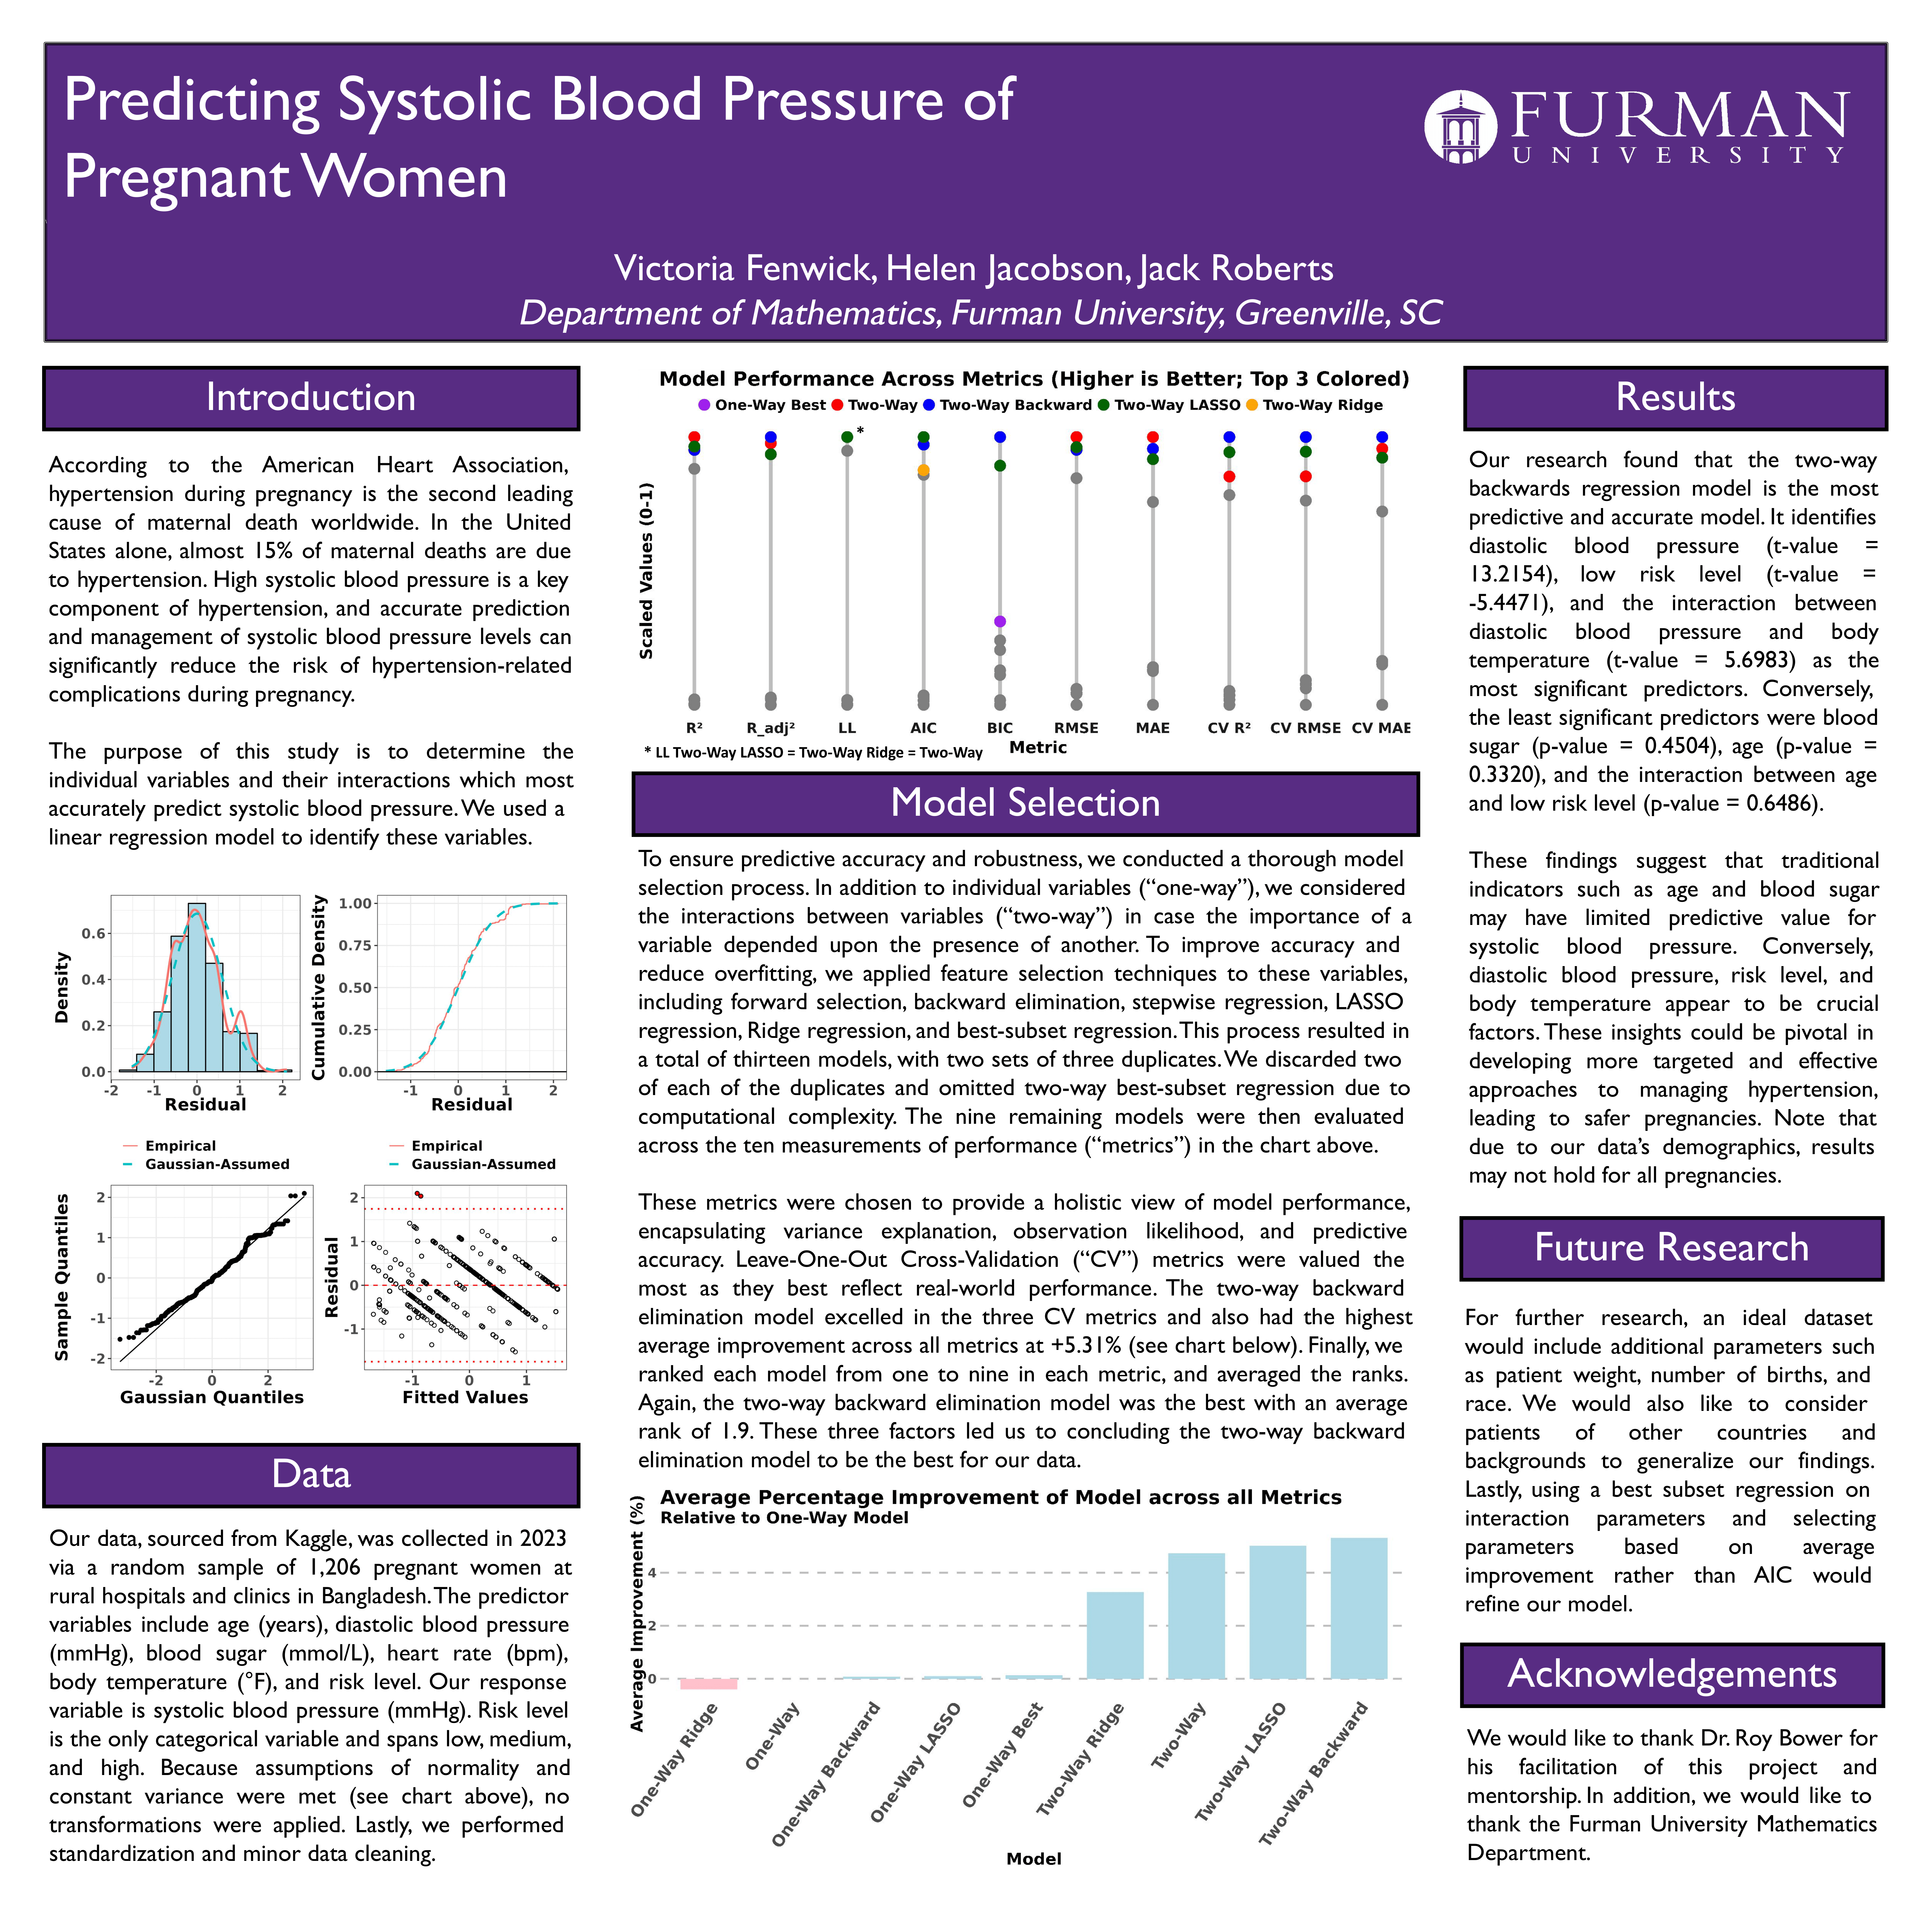
Maternal Health Risk Prediction
Furman University
Statistics in R final project analyzing Kaggle dataset of 1200 pregnant women using 8 regression models including Ridge and LASSO. Data pipeline built in R. Co-authored 40-page report and presented to technical and non-technical audiences.
December 2023
R
Tidyverse
GGPlot2
Data Pipelining
Sales Data Analyst
Camps Kitchen and Bar
Combined and cleaned monthly sales summaries to explore relationships between quantity sold, location, payment type, and revenue composition. Presented findings to management for business decision support.
July 2023 - September 2023
Excel
Tableau
2021
VIEW PDF
Spotify Success Prediction
Furman University
Machine learning project analyzing Spotify track features to predict song success metrics. Applied classification algorithms and feature engineering techniques to identify key factors in music popularity.
December 2021
R
Tidyverse
GGPlot2
Feature Selection

Graphic Design and Marketing Assistant
Belvedere Direct Lending Advisors
Developed marketing campaigns resulting in 100% increase of professional LinkedIn connections. Curated client lists based on business requirements, increasing direct mailing list by 30%.
June 2021 - Present
Excel

High School Diploma
Walton High School
June 2021
Graduated from Walton's STEM Engineering program. Completed four courses in engineering, four in physics, five in math, and three in computer science. Passed 13/15 AP exams and scored a 35 on the ACT on my only attempt.
Skills
🛠️ Software
Databricks
AWS
Tableau
GitHub
Excel
💻 Languages
SQL
PostgreSQL
DBML
Python
Bash
R
Java
JavaScript
HTML/CSS
📚 Libraries & Frameworks
Pandas
Flask
XGBoost
TensorFlow
Matplotlib
Tidyverse
GGPlot2
⚡ Technical Experience
Data Pipelining
Data Warehousing
ETL Pipelines
Data Modeling
Root Cause Analysis
Exploratory Analysis
Feature Selection
Model Selection
Linear Regression
Logistic Regression
Decision Trees
Neural Networks
Transformers
Statistical Tests
Model Deployment
Data Visualization
Technical Presentations
Non-Technical Presentations
Requirements Gathering
Web Development
Get to Know Me
Does Jack prefer waffles or pancakes?
Question 1 of 10